Building a Real-Time Environmental Monitoring Network
Ever felt like the official weather report or air quality index was a bit too… generic? Like it didn’t quite capture the nuances of your specific locations - the places where you actually live, work, and spend your time? I certainly did. That frustration, coupled with a desire to truly understand the environments I inhabit, sparked an ambitious project: to build not just one smart weather station, but a network of them, all feeding into a single, powerful, real-time dashboard.
My goal was to move beyond basic temperature readings. I wanted a comprehensive system capable of tracking air quality (those invisible particulate matter culprits!), CO2 levels, humidity, atmospheric pressure, and ambient light. And critically, I wanted to do this using affordable, readily available components and open-source software, making it accessible for anyone with a bit of maker spirit, and to be easily extendable and upgradeable down the line.
The vision was to strategically deploy these sensor nodes in different key locations - my home & my parents homes (both indoor and outside stations), my workplace, perhaps even the weekend getaway spot. Each node would then collect local data in real time, and all of it would converge onto a central platform. This would provide me with actual view of the conditions across these different environments, offering unique comparative insights unavailable from generic public data sources (that are often dubios at best).
The core requirements
Before starting the build I detailed out what I want from the project
I want to gather as much environmental data as possible: at minimum each node needed to capture temperature, humidity, barometric pressure, inhalable particulate matter (PM1.0, PM2.5, PM10), CO2 levels, and ambient light intensity. Down the line seismisc, sound and other sensors would be added, so that needs to be kept in mind as well (bandwith, buffer size).
Transmit data wirelessly and autonomously: no manual data collection or tethering to computers. Each node needed to independently connect and send its findings. As system scales its not possible to visit all edge nodes, and take care of them. And wires are very incovinent for system like this.
Same goes for software updates - no hands on, no ssh in, esp not in embedded system.
Store data reliably and centrally: all data from all nodes needed to be aggregated and stored for historical analysis, trend spotting, and comparative insights. Maybe I don’t care about something right now, but might want to check in future. Higher resolution of recent data that degrades into lower resolutions for long-term retention of historical data was acceptable and prefered.
And finally: the eye candy. A single, interactive web dashboard, accessible from anywhere, to visualize data from any and all nodes in the network. Something my old parents could easily use.
Nodes breakdown
To create a network of weather stations, we first need to create individual weather stations (nodes), test them and then scale them. To do that, we need some electronics and an enclosure of some kind to keep everything protected from harsh weather.
Core Components
At the heart of each node is a microcontroller responsible for reading from the sensors, applying any necessary calibrations, and packaging the data (using a standardized format like JSON), along with a unique node identifier and a precise timestamp. It then sends that data over Wi-Fi to the server or stores it temporarily in the data buffer in case the network connection is lost.
Any microcontroller with a compatible number and type of I/O pins for the chosen sensors could be used in a project like this. Platforms like STM32, ESP32, or Arduino derivatives are excellent choices.
BTW, While it might be easier to program something like Raspberry Pi, microcontroller is magnitudes cheaper, fairs better in harsh conditions, and is more stable and reliable long term.
Next, each node is of course equipped with a suite of sensors to capture the target environmental parameters (well, in my case every sensor I could get my hand on). In theory consistency in sensor choice across nodes is important for comparable data, though variations are possible depending on location-specific needs etc. There is a wide selection of sensors available, some are more precise than others but are also pricier. Some all-arounders, budget-friendly and well documented sensors:
- PMS5003: Measures particulate matter (PM1.0, PM2.5, PM10).
- MH-Z19B: Detects CO₂ levels using NDIR technology.
- BME680 / BME280: Measures temperature, humidity, and air pressure (the BME680 also offers gas resistance sensing, though integrating its complex algorithm can be challenging on simpler MCUs!!).
- Photoresistor (LDR): Estimates ambient light levels simply and affordably. You probably already have one in your arduino kit.
- DS3231: Real-Time Clock (RTC) for precise timestamps of sensor data. This is crucial data needs to be stored temporarily in the Data Buffer (usually when device loses network). A module like the DS3231 is a reliable choice due to its accuracy and battery backup.
You ll also need:
- Wi-Fi Module: for microcontrollers that don’t have integrated Wi-Fi (like many Arduino boards), a dedicated module (such as the ESP-01 based on the ESP8266) is needed. Microcontrollers like the ESP32 or NodeMCU integrate this functionality. There are also arduino compatible versions and they tend to be cheaper than original arduino. YMMV
- Data Buffer: network connectivity can be unreliable, esp. out in the field. Implementing a data buffer on the node helps ensure data integrity. It can temporarily store collected data readings (each with its timestamp) and send them to the server once the network connection is restored. Because each data set is timestamped, the server can process and store it correctly later, preventing data loss during intermittent network access. This can often be implemented in software using available memory on the microcontroller.
- Power Supply Module: while battery power is an option for some deployments, you most likely need a dedicated power supply module for long-term operation. Baring the issues of getting power to device this is offten the most common point of device failure as well. Use quality supplies.
Custom enclosure design
Electronics and weather don’t mix well, so designing the enclosure is just as important as the circuitry. I wanted a custom solution, and the easiest way to achieve that was to design and 3D print the parts. I used FreeCAD for modeling because it’s free and open-source, but any 3D CAD software would work. Once the 3D models were complete, they were printed using a standard FDM 3D printer and assembled. Note however that FDM makes porous enclosures, and the plastic itself is often very sensitive to temperature and sun. Treat, coat and test your enclosure for leaks if you are 3D printing it.
When designing an enclosure, a few key things should be kept in mind:
- Protect the core electronics: everything except the sensors needs excellent protection from the weather. The microcontroller, power supply, and other sensitive components must be shielded from moisture (rain, snow, condensation) and direct sunlight, which can cause overheating. At the same time you must ensure that you are getting heat, noise etc out of the enclouse, and away from the sensors.
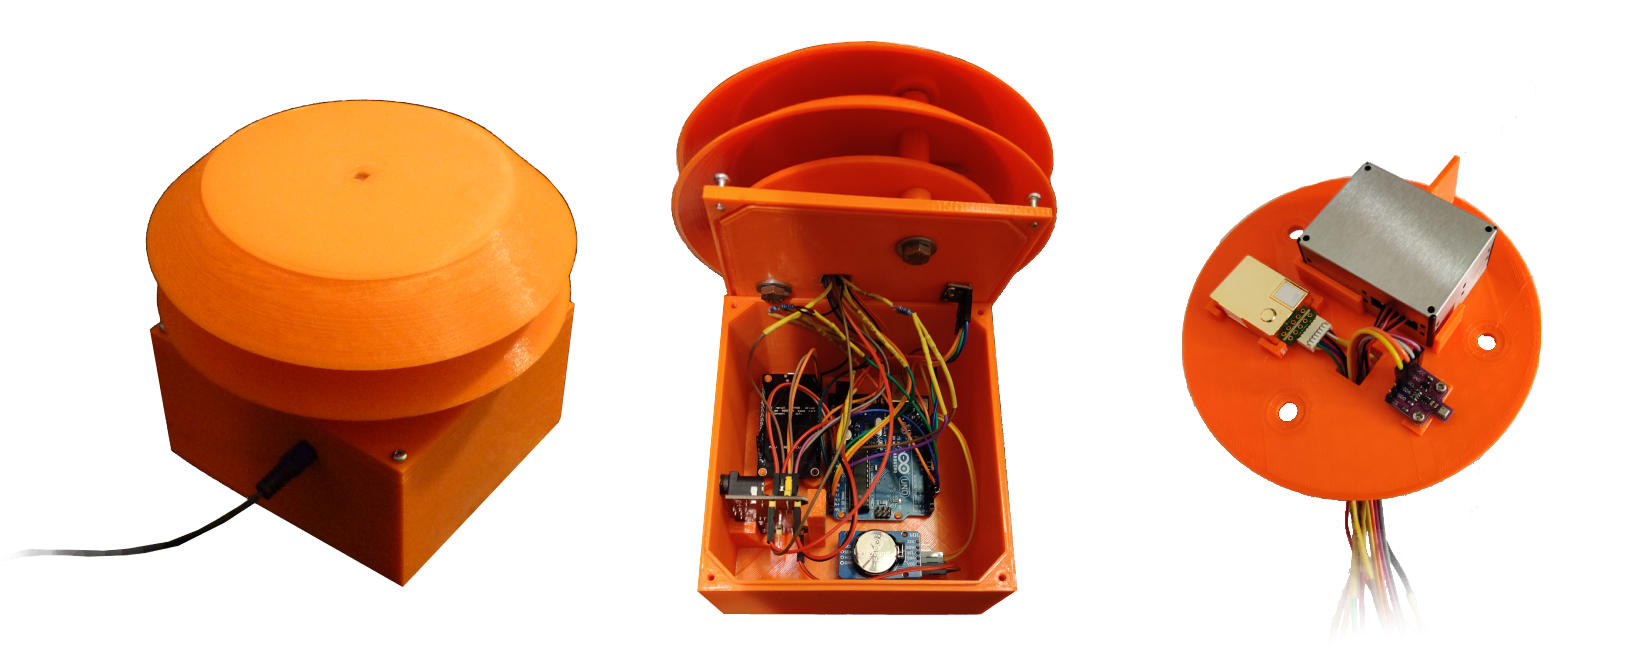
- Expose sensors correctly: sensors need exposure to the environment they’re measuring, but direct exposure can be damaging or lead to inaccurate readings. The enclosure must allow adequate airflow for temperature, humidity, gas, and particle sensors while shielding them from direct rain, snow, and intense solar radiation. The “Stevenson Screen” or “pagoda-style” approach (using stacked, inverted bowls or plates with gaps for airflow) is a proven method for achieving this balance. Do note that bugs WILL make home in it, and account for that.
- Durability: if this is not clear by now, the enclosure needs to withstand prolonged exposure to potentially harsh weather. Material choice (e.g., UV-resistant PETG or ASA filament for 3D printing) and structural design (wall thickness, reinforcements) play crucial roles in the longevity of the weather station node.
This is how my first enclosure looked like once everything was assembled:
Central Server: From Individual Nodes to a Cohesive Network
Once we have multiple weather station nodes deployed, we need a central system to connect them. The purpose of the central server is to collect data from each node, store it durably, process it, and make it available for visualization in an interactive way.
To accomplish this, the server backend needs to be designed for scalability and reliability. Here are some core elements it consists of:
- Ingestion API: A robust API endpoint acts as the gateway for all incoming data from the distributed nodes. Built with a web framework like Python’s Flask or FastAPI, it needs to handle potentially concurrent connections from multiple nodes and parse the incoming data (e.g., JSON payloads) efficiently.
- Data Processing & Routing: Upon receiving data, the server should validate it (check for expected format and values), identify the source node using its unique identifier sent in the payload, and format the data appropriately for storage in the time-series database.
- Time-Series Database (TSDB): A database optimized for handling timestamped data is essential. Options like Graphite (with Carbon/Whisper), InfluxDB, Prometheus, or TimescaleDB are good choices. They efficiently store and query large volumes of data points tagged with timestamps and identifiers (like the
node_id). Thisnode_idbecomes a key part of the metric naming convention (e.g.,node_home.temperature,node_work.pm25), allowing easy filtering and aggregation. - Alerting System (Optional but Recommended): For a truly smart system, an alerting mechanism (often integrated with the TSDB or visualization layer) can be configured. This allows the system to automatically notify you of critical conditions detected at any node (e.g., dangerously high PM2.5 levels at home or extreme temperatures at the office).
Observing Data: The Unified Web Dashboard - Turning Numbers into Insight
Collecting gigabytes of environmental data is pointless if you can’t easily understand it. Raw sensor readings - timestamps, temperature values, particle counts - are just numbers in a database. The real magic happens when you visualize that data, turning it into actionable insights. This is where the web dashboard comes in; arguably, it’s the most critical user-facing part of the entire networked weather station project, and frankly, where you can easily spend a significant amount of development time refining the user experience.
My goal wasn’t just to display data from one source, but to create an intuitive, informative, and accessible window into the multiple environments my network was monitoring.
Designing for Insight: Key Dashboard Considerations
Before diving into tools, I defined what success looked like for the dashboard:
- Accessibility (Multi-Platform): You’ll want to check conditions from wherever you are - your desktop, tablet, or phone. The dashboard needed to be web-based and ideally responsive or adaptive.
- Rich Visualization Capabilities: Simple line plots aren’t enough. I needed a tool capable of various chart types (time-series graphs, gauges, single stats, tables, potentially even maps if location data is included) to represent different kinds of data appropriately. Temperature trends look great on a line graph, but the current CO2 level might be better suited to a gauge.
- Interactivity and Customization: A static display falls short. Users need to interact with the data:
- Node Selection: Easily filter the view to show data from a specific node or compare data across multiple nodes.
- Time Range Selection: Effortlessly view data from the last hour, day, week, or a custom historical period.
- Zooming/Panning: Drill down into specific events or periods on graphs.
- Data Exploration: Easily compare different metrics within a node (e.g., plotting temperature against humidity) or the same metric across different nodes.
- Clear Overview: Provide an “at-a-glance” summary of current key conditions across the network or for a selected node.
- Performance: The dashboard should load reasonably quickly and feel responsive, even when querying significant amounts of historical data from multiple sources.
- Maintainability: Building a complex frontend framework from scratch is time-consuming. Leveraging existing, well-maintained tools was a priority to save time and avoid reinventing the wheel.
The “Build vs. Use” Dilemma: Choosing Grafana
Building a feature-rich, interactive dashboard framework suitable for a multi-node IoT network is a massive undertaking. You’d need to handle data querying across potentially different sources, complex chart rendering, user interaction states, responsive design, browser compatibility, authentication, and more.
This assessment quickly led me to explore established open-source solutions. While several options exist, Grafana stood out as the ideal choice for this project:
- Open Source & Free: No licensing costs and backed by a large, active community.
- Mature & Widely Adopted: A battle-tested platform used extensively in IT monitoring, IoT, industrial control systems, and data analytics.
- Data Source Agnostic: Crucially, Grafana excels at connecting to multiple data sources, including popular time-series databases like Graphite, InfluxDB, Prometheus, and many others. This was perfect for potentially evolving the backend or integrating other data types later.
- Powerful Visualization: Offers a vast array of “panel” types (graphs, gauges, tables, heatmaps, single stats, text, maps, etc.) with extensive customization options.
- User-Friendly Interface: While incredibly powerful, Grafana’s UI for building dashboards is relatively intuitive. Defining queries, customizing panels, and arranging layouts becomes straightforward with some practice.
- Templating & Variables: Grafana’s templating feature is key for a multi-node setup. You can create variables (e.g., a dropdown list of
node_ids fetched from your database) and use them within your panel queries. This allows you to build one dashboard structure that dynamically displays data for the selected node(s), rather than building separate dashboards for each. - Alerting Engine: Grafana includes a robust alerting system that can monitor data from any connected source and trigger notifications based on defined rules.
Grafana ticked all the boxes, providing a flexible, powerful, and maintainable solution for visualizing the data from the entire network.
The End Result: Interactive Insight Across Your Network
The final Grafana dashboard provides a dynamic, unified, and easy-to-understand view of the data collected across all deployed weather station nodes. Users can:
- Select a specific node from a dropdown to view its detailed data.
- View comparison graphs showing the same metric (e.g., temperature) across multiple nodes simultaneously.
- Quickly grasp current conditions via gauges and summary panels.
- Analyze historical trends over various time windows using interactive graphs.
Grafana elegantly handles the complexities of querying data from potentially multiple sources (even if just multiple metrics within one TSDB) and rendering sophisticated visualizations. This allows the focus to remain squarely on interpreting the environmental insights the network provides, rather than on building the visualization tool itself.
Choosing Grafana proved instrumental in creating a professional-grade visualization layer without the immense overhead of custom development, perfectly complementing the distributed DIY hardware and central data pipeline.
What I Learned and What’s Next
Building this environmental monitoring network was a fantastic dive into practical IoT development on a broader scale. From wrestling with sensor libraries and ensuring robust communication from multiple, independent points, to designing a scalable server backend and a unified data pipeline, every step was a learning opportunity. The challenges of managing multiple devices, ensuring data integrity across the network, and visualizing a cohesive picture from disparate sources added a rich layer of complexity and reward compared to a single-node project.
The system works reliably, providing fascinating, comparative insights into the microclimates of my most frequented locations. But like any good tech project, there’s always room for improvement and expansion:
- Adding More Nodes: The architecture is designed for it! Expanding the network to monitor more diverse locations (indoor/outdoor, urban/rural) is a natural next step to gather richer comparative data.
- Enhanced Sensor Suite: For specific locations, deploying specialized sensors makes sense:
- Wind and Rain: Anemometers, wind vanes, and rain gauges for a more complete weather picture at key outdoor nodes.
- Better Light Sensing: Dedicated lux sensors for more precise illuminance data where seasonal light changes are significant.
- Noise Levels: Incorporating sound sensors to track and compare ambient noise pollution in urban vs. suburban or work vs. home environments.
- Power Optimization: Exploring low-power modes (deep sleep) for the microcontrollers combined with solar power and battery backups for truly autonomous, off-grid node deployments.
- Machine Learning for Insights: With a growing, multi-location dataset, applying machine learning techniques could uncover interesting correlations between locations, predict local conditions more accurately based on network-wide trends, or detect environmental anomalies specific to one area.
- Data Sharing/API: Potentially creating a public API endpoint to share anonymized data or specific metrics with the wider community or other interested individuals.
Building this weather station network has been incredibly rewarding. It’s not just about the final product, but the journey of designing a distributed system, tackling connectivity challenges, managing data flow, and ultimately creating something that provides real, tangible, and highly personalized environmental value. If you’re looking for a project that scales beyond a single device and combines hardware, networking, software, and a direct connection to the world around you, I highly recommend trying your hand at building your own smart environmental monitoring network!
Last updated 2024.